Diesel Jumps 19.7 Cents to $5.454 and Erases the Break
The national average for the week ending August 17 came in at $5.454 a gallon, up 19.7 cents. The Midwest moved 25.4 cents, and the gap between the priciest and cheapest reported regions is back to 99.9 cents.
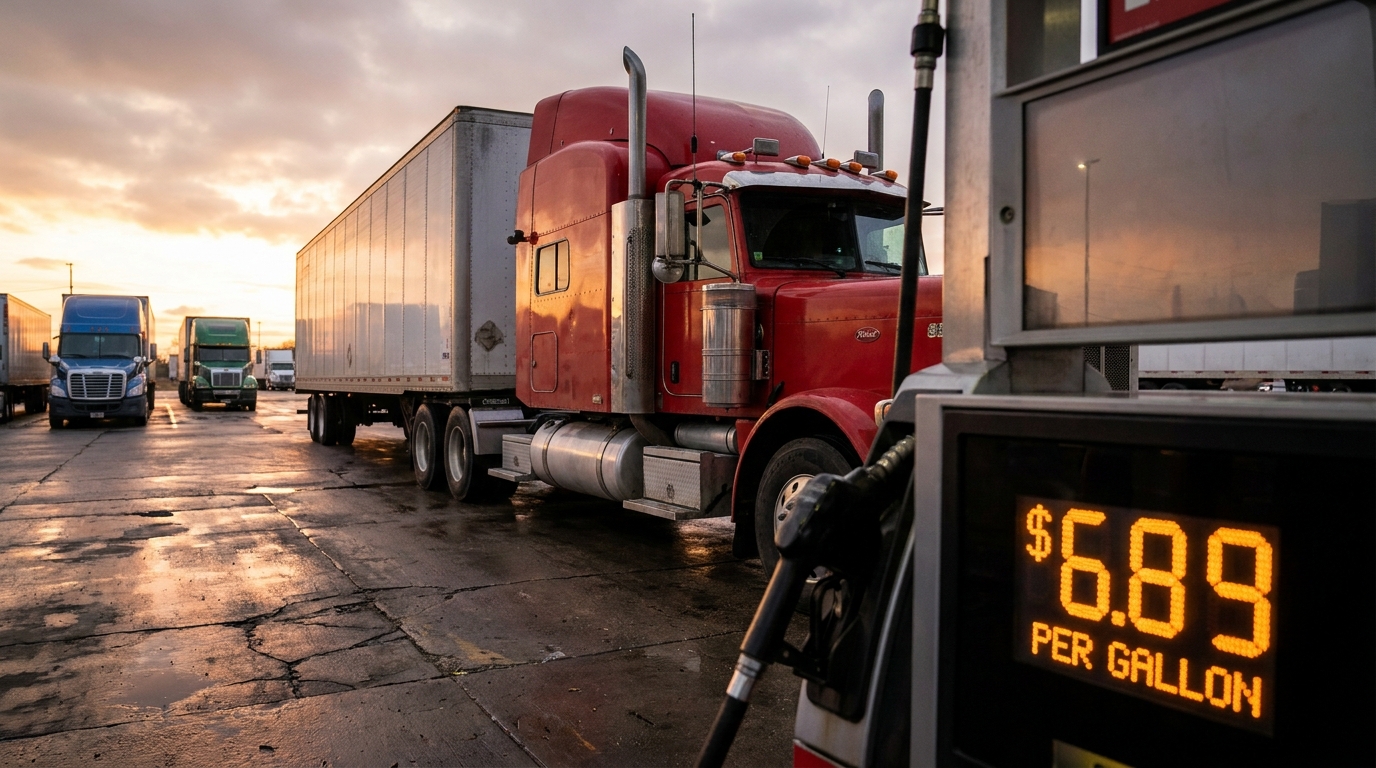
Last week diesel gave you nine cents back. This week it took nineteen. The national average for the period ending August 17, 2026 came in at $5.454 a gallon, up 19.7 cents from $5.257 the week before. That is a 3.75% move in seven days, and it is the sharpest weekly jump of the month.
One week does not make a trend. But this one wiped out the only break the market has given owner-operators since mid-July, and it did it in a single print.
The number next to the month
Four weeks ago, for the period ending July 20, the national average was $5.134. Today it is $5.454. That is 32 cents a gallon in four weeks, a 6.23% climb, with last week's dip already counted inside it.
Read those two figures together and the picture is honest: the trend never turned. It paused for one week and then resumed at a faster pace than before the pause.
What it costs a real truck
Take a tractor that runs 6.5 miles per gallon and covers 2,500 miles a week. That is roughly 385 gallons. At $5.257 that week of fuel cost about $2,022. At $5.454 it costs about $2,098.
Seventy-six dollars a week, same lane, same truck, same driver. Against the July 20 price it is about $123 a week. Hold that for a year and it is close to $4,000 that never showed up as a decision — no bad load, no missed appointment, no repair. Just the pump.
Run that arithmetic with your own mpg and your own miles before you accept anybody's average, including this one. The method is worth more than the example.
The Midwest took the worst of it
The increase was not spread evenly. Padd 2, the Midwest region, moved up 25.4 cents in one week to $5.435 — a 4.9% jump, and 8.96% over four weeks. If your lanes live between Chicago and Kansas City, your fuel bill moved more than the national headline says it did.
The spread across the country is close to a dollar again. The most expensive reported region, Padd 5, is at $6.203. The cheapest, Padd 1C, is at $5.204. That is 99.9 cents a gallon between one part of the map and another, or about $150 on a 150-gallon fill.
That spread is why a single national number is a poor basis for a surcharge table. Two carriers running the same rate per mile, one in the Midwest and one on the East Coast, are not paying the same cost this week — and the customer paying both of them is usually working from the same national average. If your surcharge is indexed to that average alone, the region you actually run in decides whether it over-recovers or quietly eats your margin.
One caution that decides whether you use this correctly: this dataset does not publish all fifty states. It reports national, regional and a small number of individual areas. California, the only individual state carried in the series, printed $6.785. A regional figure is not a state figure, and treating one as the other sends you to the wrong pump.
Four things to do with this print
- Re-base your fuel surcharge this week, not next month. A surcharge built on the August 10 average is under-recovering 19.7 cents on every gallon you burn.
- Plan the fill, not the stop. With a dollar between regions, where you buy is worth deciding before you leave, not at the exit ramp.
- Recalculate cost per mile before you quote. Thirty-two cents a gallon in four weeks moves the floor under every rate you accept.
- Count your idle hours. Every hour the main engine runs parked is billed at the new price, and it is the one line on this list that does not require anyone else to agree with you.
That last one is where the money hides in a week like this. The worksheet for what parked hours actually cost at today's price is in our guide on how much fuel an APU can save, and you can ask for an assessment built around your own duty cycle from Go Green APU. Practical cost guidance for owner-operators and small fleets is collected at The Truck Savers.
Original source
Prices and periods taken from the weekly series: U.S. Energy Information Administration, Weekly Retail On-Highway Diesel Prices, period ending August 17, 2026.