The Same Gallon Costs $1.38 More on the West Coast
The West Coast pays $6.987 a gallon and the Lower Atlantic $5.605. Same survey, same week, a $1.38 spread.
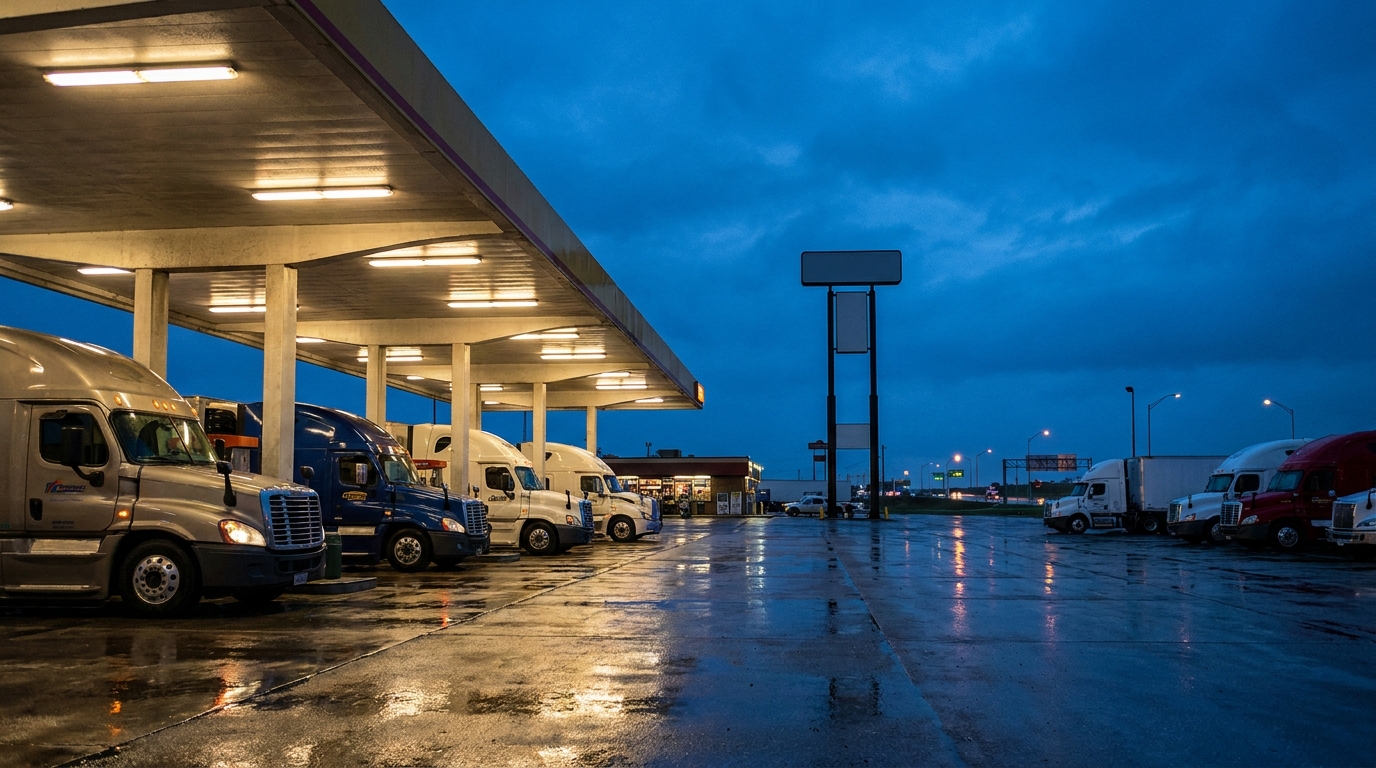
Two trucks fill up the same week, off the same survey, and one pays a dollar thirty-eight more per gallon than the other. Neither driver did anything wrong. They were standing in different places.
The weekly retail on-highway survey for the period ending September 7 put the most expensive reported region at $6.987 a gallon and the cheapest at $5.605. The distance between them is $1.382.
What a dollar thirty-eight actually costs
Against a 200-gallon fill, that gap is $276. Not over a month, not over a quarter. On one stop.
Against the road, it works out about the same. A truck turning 6 miles per gallon burns roughly 23 cents more per mile on the expensive side of the gap. Run 1,200 miles and you have arrived at $276 again by a different road.
The national average that week was $5.967. It makes a fine headline and a poor planning number, because almost nobody pays it. What you pay is whichever region you happen to be parked in.
Which regions those are
The high figure belongs to PADD 5, the West Coast. The low one to PADD 1C, the Lower Atlantic. The rest of the map filled in between them: the Gulf Coast at $5.754, the Rocky Mountain region at $5.805, the Midwest at $5.946, New England at $5.990, and the Central Atlantic at $6.051.
One thing to keep straight, because this is the mistake the data invites: those are regions, not states. PADD 3 is not Texas. It is the Gulf Coast, and Texas sits inside it along with several neighbors. The survey does not publish a separate price for most individual states, and a regional average was never a promise about the exit you are about to take.
California is doing most of the lifting
The one state this release reports on its own is California, at $7.764. That is the highest number in the set and $2.159 above the Lower Atlantic.
Now the part worth writing down. The same release also reports PADD 5 excluding California, and that figure is $6.314. So the West Coast region reads $6.987 largely because California is counted inside it. Lift that one state out and the region falls 67 cents.
For anybody planning a lane, that is a more useful sentence than "the West Coast is expensive." Oregon, Washington and the rest of PADD 5 are described far better by $6.31 than by $6.99. The region did not get costly all at once; one state inside it did.
The gap itself is widening
Compare the two ends to where they stood four weeks earlier and something shows up that neither price shows alone.
PADD 5 climbed 95 cents in four weeks. PADD 1C climbed 57 cents over the same stretch. Both went up — but not together, and the difference between those two moves is 38 cents.
Do the subtraction on the older week and the gap back then was about $1.00. Today it is $1.382. The spread between the cheap end of the country and the expensive end grew by better than a third of a dollar while everyone was watching the headline average.
That is the number that changes how you plan, because a widening gap rewards knowing your route in a way a flat one never did.
Three ways to use it instead of admiring it
Treat the tank as a decision, not a reflex. If your lane crosses out of a $5.60 region and into a $7.00 one, where you top off is worth more than most of what you will argue about that day.
Quote by region, not by national average. A rate built on $5.967 does not survive a California leg. The figure that belongs in the quote is the one for the ground the truck will actually be standing on.
Re-check every week. This is published once a week and it moved 38 cents apart in four. Nothing guarantees the gap stays this wide, and nothing guarantees it stops here either.
Read the survey for what it is
Two cautions that save arguments at the fuel desk.
First, this is a weekly survey, not a daily quote. A daily average from somewhere else can disagree with it and neither one has to be wrong — they measure different things over different windows. When you cite the gap, cite it as the weekly figure it is.
Second, the survey is silent on most individual states, and silence is not a low number. Filling that in from memory is exactly how a planning figure turns into a bad one.
How the truck drives, you control. Where it stops, you can at least read ahead of time.
Alignment, suspension and tires in Houston, Dallas and Monterrey: thetrucksavers.com.
Source: U.S. Energy Information Administration, weekly retail on-highway diesel prices