How to Read BTS Truck Travel Times With Stops Included
BTS county travel times include stops. Check the year, sample limits and elapsed-time definition before using them for dispatch.
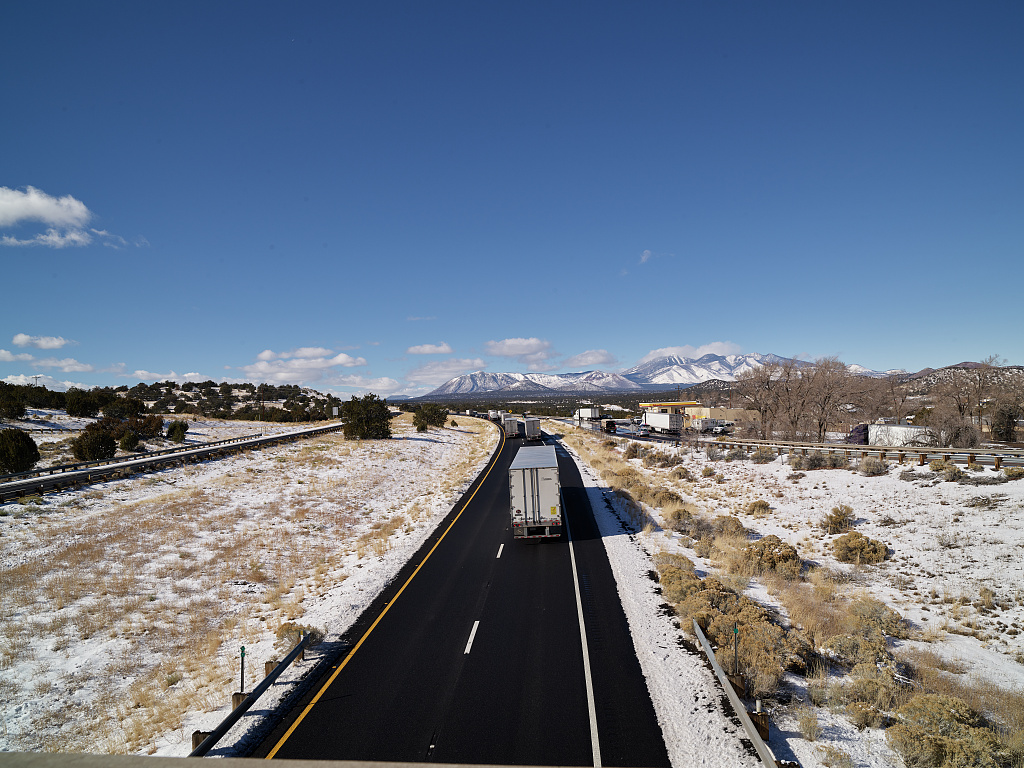
Illustrative archive photograph: truck traffic on Interstate 40 west of Winslow, Arizona, December 2, 2018. Carol M. Highsmith / Library of Congress, LC-DIG-highsm-54656; no known restrictions on publication. Unmodified image, not a view of current traffic or a specific BTS sample vehicle.
A historical truck travel-time figure can help frame a dispatch question, but only if everyone understands what the clock measures. The Bureau of Transportation Statistics' county-to-county product includes time spent stopped as well as moving. Its observation begins at a truck's last recorded position in the origin county and ends at its first recorded position in the destination county. It is not a door-to-door estimate for a particular load.
BTS describes the product on its Freight Mobility Initiative page, dated November 19, 2026. The available annual series covers 2018–2025. The date on that information page should not turn the project into a newly launched service: BTS announced the initiative in August 2025. This guide focuses on how an owner-operator or small dispatcher can read the public statistics without assigning them a meaning they do not have.
Separate the database from the public product
The core initiative draws on anonymized truck-position data obtained from the American Transportation Research Institute. The current program description refers to approximately 300,000 unique truck tractors and observations beginning October 1, 2018. That is a sample, not a census of every truck or business operating on a lane.
Access to the underlying position records is restricted to federal employees and designated contractors. Public, approved aggregate products are freely accessible. A download of county-level travel-time statistics therefore does not provide a way to track a competitor, identify a particular driver, inspect a customer's freight or reconstruct an individual truck's working day. Keep that distinction when discussing the resource with a customer.
Read the clock before comparing a lane
The county boundaries define this measurement. Travel within the origin county before the last ping, and travel within the destination county after the first ping, sit outside the stated endpoint definition. The total that remains includes stopped and moving time between those observations. It should not be renamed driving time or used as a substitute for the actual pickup and delivery appointments.
BTS reports the 25th, 50th and 75th percentile times for each county pair and year. The 50th percentile is the median, a midpoint of the observed distribution. The other two percentiles show different positions in that distribution. None is a guaranteed maximum, a prediction for today's traffic or a promise that a specific driver can legally complete a trip in that time.
Before comparing two records, keep their county pair and year visible. Do not silently combine one year's result with another year's sample or use opposite travel directions as if they were interchangeable. These are basic record-matching checks recommended by TSN, rather than evidence that any particular corridor improved or deteriorated.
A missing row does not mean no trucks
For confidentiality, BTS excludes county pairs with fewer than 100 observed connecting instances. Reported observation counts are grouped into broad bins: 100–999, 1,000–9,999, 10,000–99,999 and above 100,000. A bin describes the disclosed sample range, not the number of available loads or the total size of a lane's freight market.
The underlying sample also overrepresents long-distance fleet trucks and underrepresents short-distance drayage trucks, according to BTS. An owner-operator whose work is mostly local should be especially careful about treating the historical distribution as representative of every assignment. An absent county pair or a broad count range leaves an information limit; it is not proof of a quiet market.
Build a small planning comparison
TSN recommends starting with one recurring lane and writing down what decision the data would support. For example, a dispatcher might want to investigate why a quoted schedule differs from the business's own observed elapsed times. That is an investigation question, not a claim that the public median already explains the difference.
Record the relevant origin and destination counties, the annual dataset used and the three percentiles. Alongside them, keep the operation's own dated trip records with clearly defined endpoints. Distinguish waiting, parking and facility processes when those details are actually available. Do not infer a specific cause of delay from an aggregate county statistic that does not identify it.
- Verify the county pair and direction before comparing figures.
- Keep the annual observation period attached to every number.
- Label the measure elapsed time, with stops included.
- Record confidentiality and sample limits beside the result.
- Check live conditions, appointments and driver availability separately.
- Leave unanswered causes open rather than assigning a convenient explanation.
Use the result to ask a better question
An aggregate travel-time distribution can guide further review of a recurring route. It cannot set a freight rate, establish detention owed, certify hours-of-service compliance or guarantee delivery performance. Those decisions require the applicable records and circumstances, which the public dataset does not supply.
When the planning question includes where to find services along the trip, use TSN's business directory and confirm each location's actual services directly. A listing does not establish live parking availability or a booked appointment. Keep historical comparisons, current operating checks and service confirmations separate before committing the truck to the next assignment.
Original source: Bureau of Transportation Statistics: Freight Mobility Initiative.