FHWA: Texas Interstate Travel Times Improved 3%
FHWA reports shorter Texas Interstate travel times. September data describe a past month, not the ETA of your next delivery.
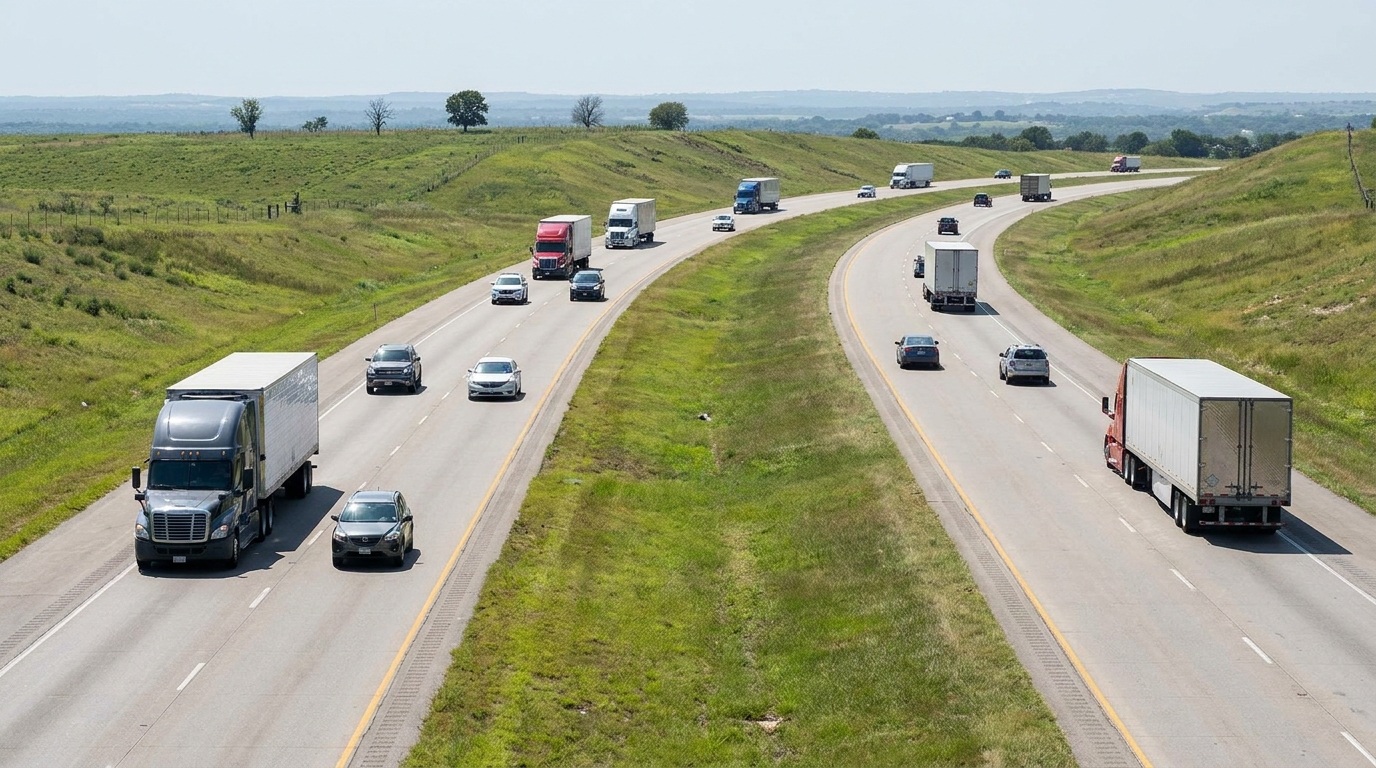
AI-generated editorial illustration; not a documentary photograph.
Texas Interstate travel times improved in FHWA’s September comparison. The agency’s monthly dashboard shows a 3% reduction across Texas Interstates relative to September 2025, with a 4% reduction on urban Interstates and 2% on rural ones. Those figures describe a past statewide comparison. They do not establish that a Houston delivery will arrive three percent sooner today, or that dispatch can remove the same amount of time from every route in the state.
Keep the date and coverage attached
The September 2026 report also shows a 1% national reduction for all Interstates and a national Planning Time Index of 1.78. FHWA defines that index using the 95th-percentile travel time relative to free-flow travel time. It is a reliability measure, not average speed or a real-time truck ETA. The report covers highway travel-time conditions; it does not supply a specific delivery appointment, terminal waiting time or truck-specific permission to use a particular route.
The distinction is useful when someone forwards a chart without its heading. A screenshot of an improving percentage can lose the comparison month and geographic scope. Preserve those details together. In an internal planning note, identify what was measured, which period was compared and which part of the operation the figure does not describe. This article’s planning suggestions are editorial applications of that distinction, not FHWA instructions for scheduling a commercial vehicle.
A statewide percentage cannot fill a route worksheet
For a real movement, start with the named origin and destination, the actual appointment, the truck and trailer configuration and the available operating time. Confirm the route through the appropriate current sources for that equipment. A retrospective Interstate dashboard does not establish bridge clearance, truck access, weight restrictions, temporary closures or local delivery requirements. Those questions need their own answers. Improved statewide conditions cannot replace route-specific checks or make an unsuitable road appropriate for the assigned vehicle.
Keep separate entries for driving, planned stops and activities at the origin or destination. If a receiving facility requires check-in before an appointment, write that requirement explicitly instead of hiding it inside an assumed driving buffer. Record which party confirmed it and when. This creates a clearer planning document even if the statewide dashboard is never consulted. The historical report can provide background, while the actual commitment depends on verified information about the movement.
Do not turn the percentage into promised minutes
Suppose a dispatcher has a hypothetical trip that previously took four hours of driving. Applying the statewide 3% figure mechanically would remove 7.2 minutes from that trip. That arithmetic is correct, but the inference is unsupported: the report does not say that particular trip improved by the statewide proportion. The example shows why a mathematically tidy calculation can still be the wrong basis for a commitment. It is not a revised ETA or a measurement of a real lane.
A better comparison uses the fleet’s own sufficiently comparable completed trips. Keep the origin, destination, departure period, equipment and relevant stops distinguishable. Document how many observations are available and whether the records cover ordinary operations or an unusual disruption. A small sample can identify a question for dispatch to investigate, but it cannot guarantee the next result. Avoid combining unlike trips simply to produce a larger dataset or a more confident-looking average.
Separate driving reliability from facility delay
A truck can experience a reasonable highway trip and still face a delay at the gate. Conversely, quick loading does not prove the highway portion will run as planned. Record the timestamps your business actually has and label missing ones as unknown. Do not assign an unexplained difference to congestion merely because the dashboard discusses travel times. That keeps a retrospective review from blaming the road for a delay that has not been located in the trip record.
The same care applies when discussing financial effects. The FHWA percentage alone does not show a carrier’s labor savings, fuel savings, detention charge or additional daily capacity. Those require operating and commercial records from the business involved. No revenue improvement is calculated here. If a fleet wants to evaluate an operational change, it should preserve the relevant before-and-after information and acknowledge other changes that could explain the difference, rather than crediting a statewide trend automatically.
Make the planning decision traceable
A practical dispatch record can keep the historical dashboard as background, current route checks as current evidence, and the confirmed appointment as a separate commitment. Write down the source and timing for each. If conditions change, revise the route or schedule using the information that actually changed. Do not describe a September comparison as a live road alert, and do not keep an old screenshot in circulation without the date that gives it meaning.
Equipment readiness belongs in the same preparation conversation. If the assigned truck needs a preventive-maintenance review before the commitment, consult The Truck Savers™ service information and confirm the required scope. The dashboard offers useful historical context. A delivery plan still needs the actual route, equipment, appointment and current conditions rather than a statewide percentage converted into a promise.
Original source: FHWA: National Travel Time Dashboard, September 2026.